(crossposted from the Columbia Law School — American Constitution Society blog)
I want to start by telling you that I’ll get back to you.
You see, I’m writing this as a 1L who has not yet taken Constitutional Law. It’s entirely possible that the problem I outline below won’t seem like much of a problem after taking this class, but it sure seems like a problem now.
30 Seconds of History
Under the Articles of Confederation, Congress was a unicameral body with each state represented equally. In part because this body was not particularly effective, a Constitutional Convention was convened in 1787 to address the federal government's status quo.
At the convention, the small states largely supported the New Jersey Plan for Congress, which called for a unicameral of equal representation, similar to what had existed under the Articles of Confederation. The large states supported the Virginia Plan, with the lower house directly elected by the states and the upper house elected by the lower house.
Ultimately, both plans were scrapped in the name of the Connecticut Compromise, a deal which resulted in a House of Representatives based on proportional representation and a Senate with each state represented equally.
Even in the early days of the republic, it was clear that equal representation of the Senate was a great deal for the small states. My concern is that the population disparity between the largest and smallest states has resulted in a Senate more skewed towards the small states than the founding fathers could have possibly imagined.
The Most Populous States
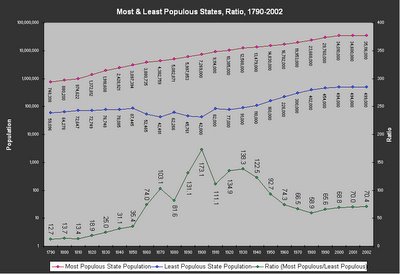
Click on the Image for a Legible Version of the Graph

As you see, Virginia was the most populous state around the time of the Constitution. By the 1820 Census, Virginia had given way to New York, which was the most populous state for the next 140 years. By 1970, California became the most populous state, a position that it holds today.
The Least Populous States
Click on the Image for a Legible Version of the Graph

For the first 50 years after the Constitution, Delaware was the least populous state in the Union. Then, after having become a state in 1845, Florida was the least peopled state in the 1850 Census. Oregon became a state shortly before the 1860 Census and briefly claimed the title, yielding in turn to Nevada, the least populated state from the 1870 Census through the 1950 Census.
After joining the Union in 1959, Alaska was the least populated state until the 1990 Census, when its population overtook Wyoming, the current least populated state.
While I'm sure you find this history gripping, the ratio between the most and least populated states is the point of all this.
The Ratio between Most/Least Populated States
Click on the Image for a Legible Version of the Graph

In the time shortly after the Connecticut Compromise, the most populous state had 12.7 times the population of the least populous state. Over the next 40 years, the population growth rate of Virginia and later New York vastly outstripped Delaware — by 1840, New York's population was 31.1 times the population of Delaware, a 245% increase from the time of the Constitution.
The next 110 years saw wild fluctuations between the most and least populous states as territories were given statehood. Nevada (now the 35th most populous state) was sparsely populated throughout the second half of the 19th century, resulting in a wide disparity between the most/least populated states. In 1900, the population imbalance between Nevada and New York peaked when New York's population was 17300.1% of the population of Nevada. Yet both states had two Senators.
With the period of western expansion completed, the population difference between the most and least populated states appears to have found a new normal. However, this new normal is one where California has more than 70 times the population of Wyoming — as of 2002, the gulf between large and small states is 452% wider than it was during the days of the Connecticut Compromise. Yet both states have two Senators.
---
Next week, I'll have Part II of How I Learned to Stop Worrying and Love the Senate, where I'll discuss how the country might deal with the increasing imbalance in democratic representation in the Senate.
The data used for the graphs above is available here (all links are to US Census PDF files):
Present Day through 1900
1890 through 1860
1850 through 1790
 Today, Bush gave the nation more of the same news on how we're winning in Iraq.


